
API reporting for operators: how to build dashboards around AI visibility evidence
A practical operator guide for using DoneHat reporting data without losing the evidence and limitations that make it trustworthy.
Who this guide is for
Developers, analysts, and technical marketers
Design the dashboard around evidence
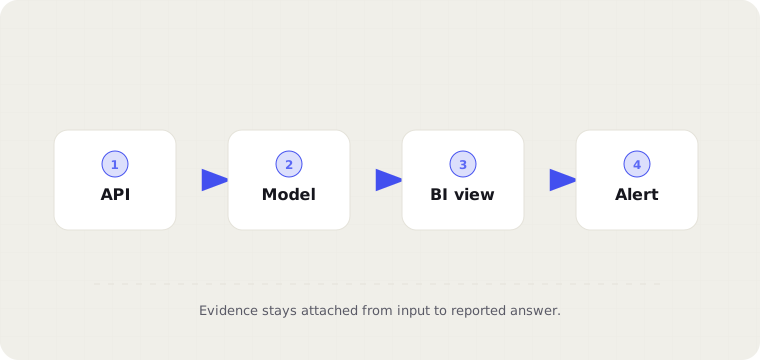
An AI visibility dashboard should not be a wall of scores. It should preserve the evidence path: brand account, scan date, buyer question group, answer source, mention state, cited sources, issue type, fix status, and proof result.
Operators should be able to move from an executive metric to the answer text that supports it. This is what keeps a dashboard credible when a stakeholder challenges a number.
Keep public and signed-in reporting separate
Public audits are useful for discovery and sharing. Signed-in brand accounts are better for ongoing measurement, team workflows, saved questions, deeper reporting, and proof history. Dashboards should make that difference clear.
Do not mix one-off public snapshots with ongoing brand-account history without labeling them. The sampling depth, freshness, and available context may differ, and the dashboard should not imply they are identical.
Use least-privilege API keys
Create API keys only for the systems that need them, store them securely, and rotate keys when access changes. Treat reporting keys like production credentials because they can expose business-sensitive visibility data.
The safest implementation is explicit: one owner creates the key, one integration uses it, and the dashboard logs when it refreshes data. Remove unused keys instead of letting them accumulate.
Model the reporting entities
A useful schema usually has brand accounts, scans, answer checks, issues, actions, proof checks, competitors, sources, and score summaries. Keep raw evidence separate from rolled-up metrics so analysts can explain how a number was derived.
Avoid flattening everything into a single score table. A score is useful, but the evidence and issue history explain what changed. The dashboard should support both executive summary and analyst investigation.
Show limitations near the metric
If a metric is directional, label it as directional. If the confidence range is wide, show that next to the number. If a source failed or the scan used a smaller buyer-question set, surface that limitation in the same view.
This is not a weakness in the dashboard. It is what makes the dashboard trustworthy. Decision-makers can tolerate uncertainty when it is clearly explained. They lose trust when uncertainty is hidden.
Refresh data based on business need
Not every dashboard needs constant refresh. Weekly reporting works for many teams. Faster refresh is useful during launches, competitive campaigns, pricing changes, or active fix cycles.
The refresh schedule should match the operating cadence. If teams review fixes every Monday, refresh before the meeting. If a launch changes positioning, scan after the new pages and public sources are available.
Integrate proof into reporting
Proof checks should appear next to completed actions. A dashboard that only shows completed work can accidentally reward output over impact. A dashboard that shows proof keeps teams focused on answer movement.
Useful proof fields include before state, after state, outcome label, source changes, answer excerpt, and timestamp. This lets operators explain why a fix was marked improved, unchanged, regressed, or inconclusive.
Build alerts for movement, not noise
Alert on meaningful changes: critical issue created, competitor overtakes the brand, inaccurate claim appears, important proof check regresses, or confidence drops for a high-intent question group. Avoid alerting on every small fluctuation.
Good alerts create action. If no one knows what to do with an alert, the threshold or message is wrong. Each alert should point to the affected answer, likely root cause, and next recommended step.